TCC · Meta · July 2026
Overview
The numbers
At a glance
TCC's Facebook presence had 295 followers at the end of the reporting period. To increase the follower count it would be benifitial for the TCC team to invite people to follow the page, and share it with any current clients and partners.
Community growth
Followers
Paid followers
Total content
Content reach
Impressions
Posts
Page views
Avg unique visitors
At a glance
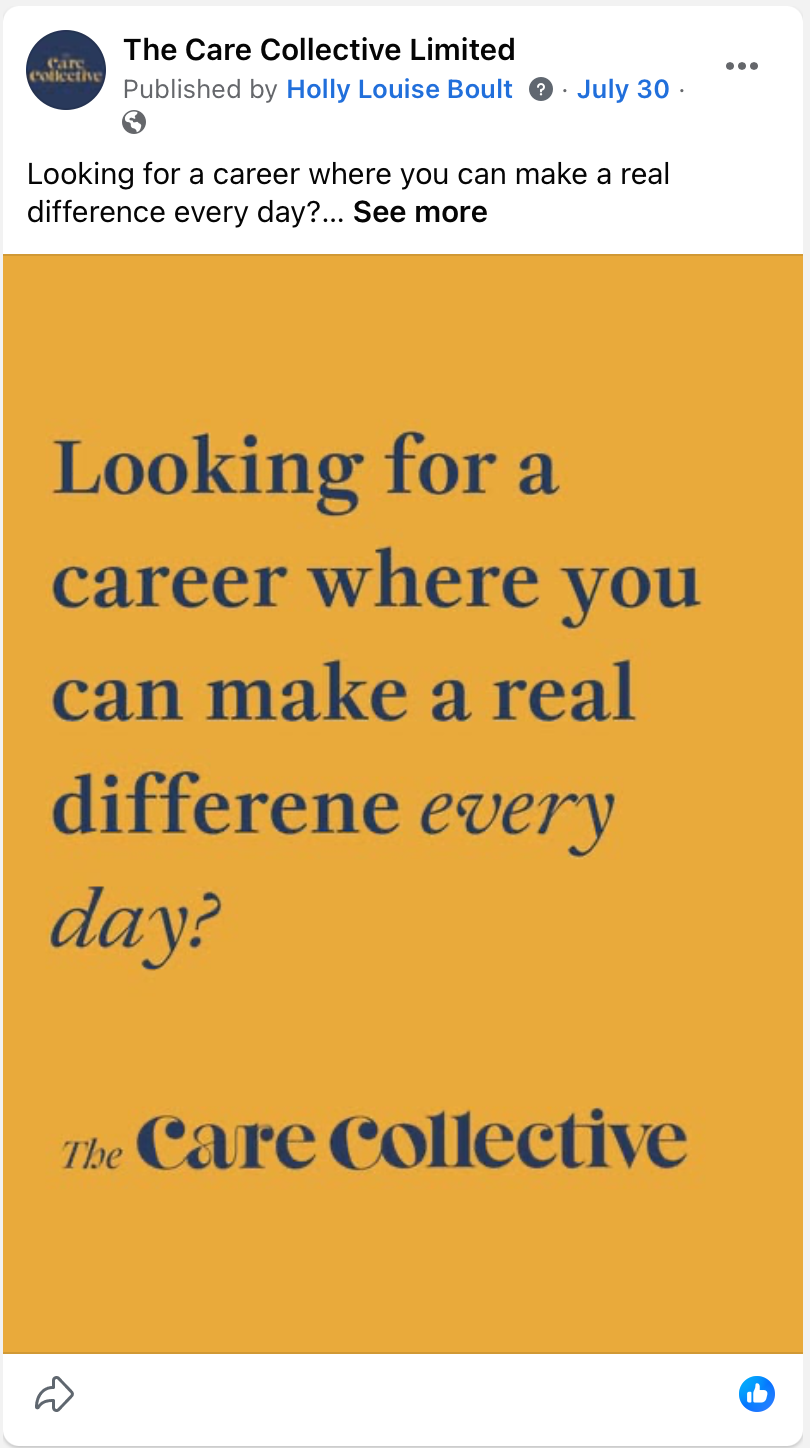
Visibility on Facebook increased substantially during the period, with impressions reaching 997, which was +38% on the previous period. This is a strong signal that content is being surfaced to a wider audience, likely driven by the increased posting activity with July being the first full month of posting on Meta. The strongest individual post by reach was the recruitment post which reached 157 impressions.
Interactions
Reactions
Comments
Clicks
Shares
At a glance
We had 2 reactions and 1 share on Facebook during the period. It's really important that we increase interactions but to do this, we need support from the TCC team to boost engagement by interacting with the content.
[Action for Kelly and the team to react to and comment on TCC content on Facebook and Instagram.]
Top posts
July 2026
At a glance
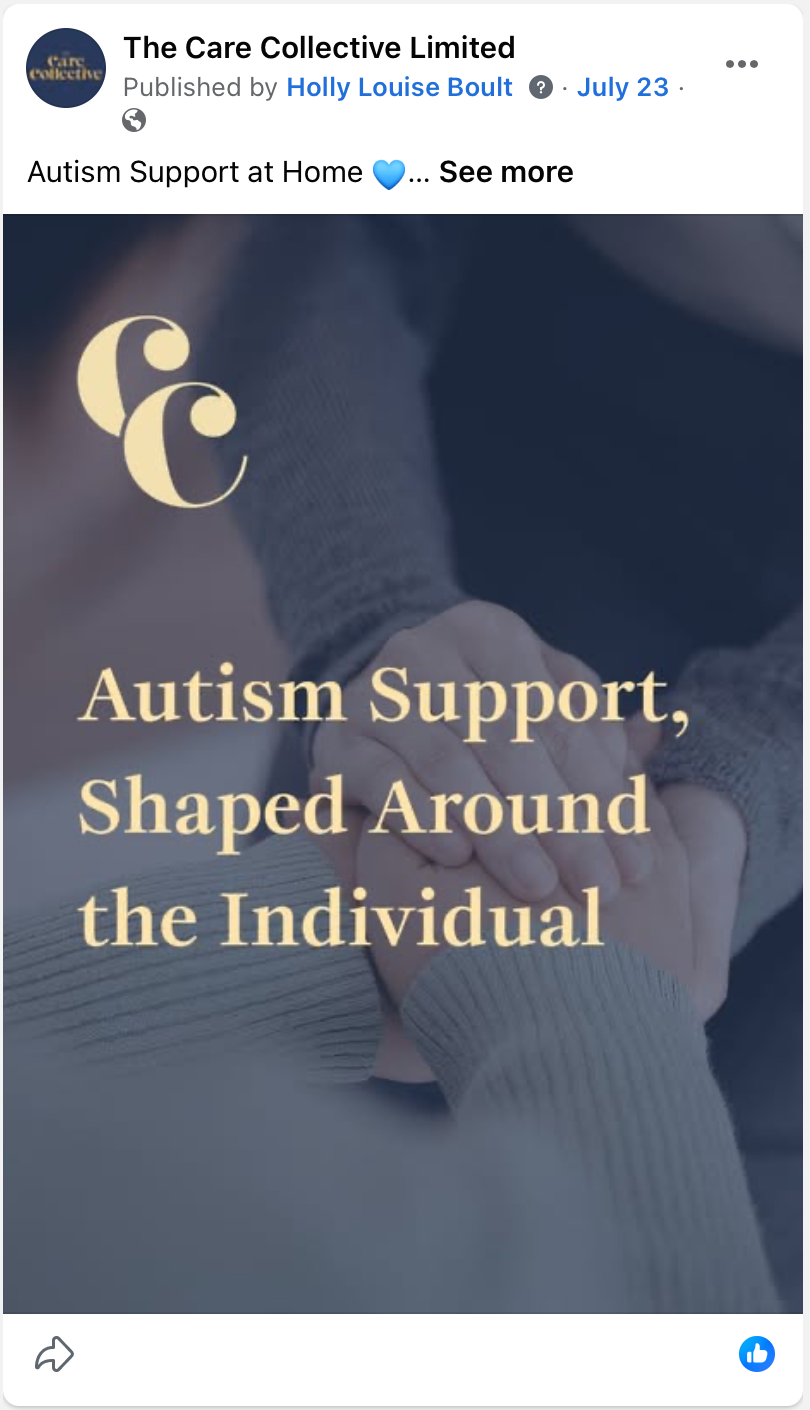
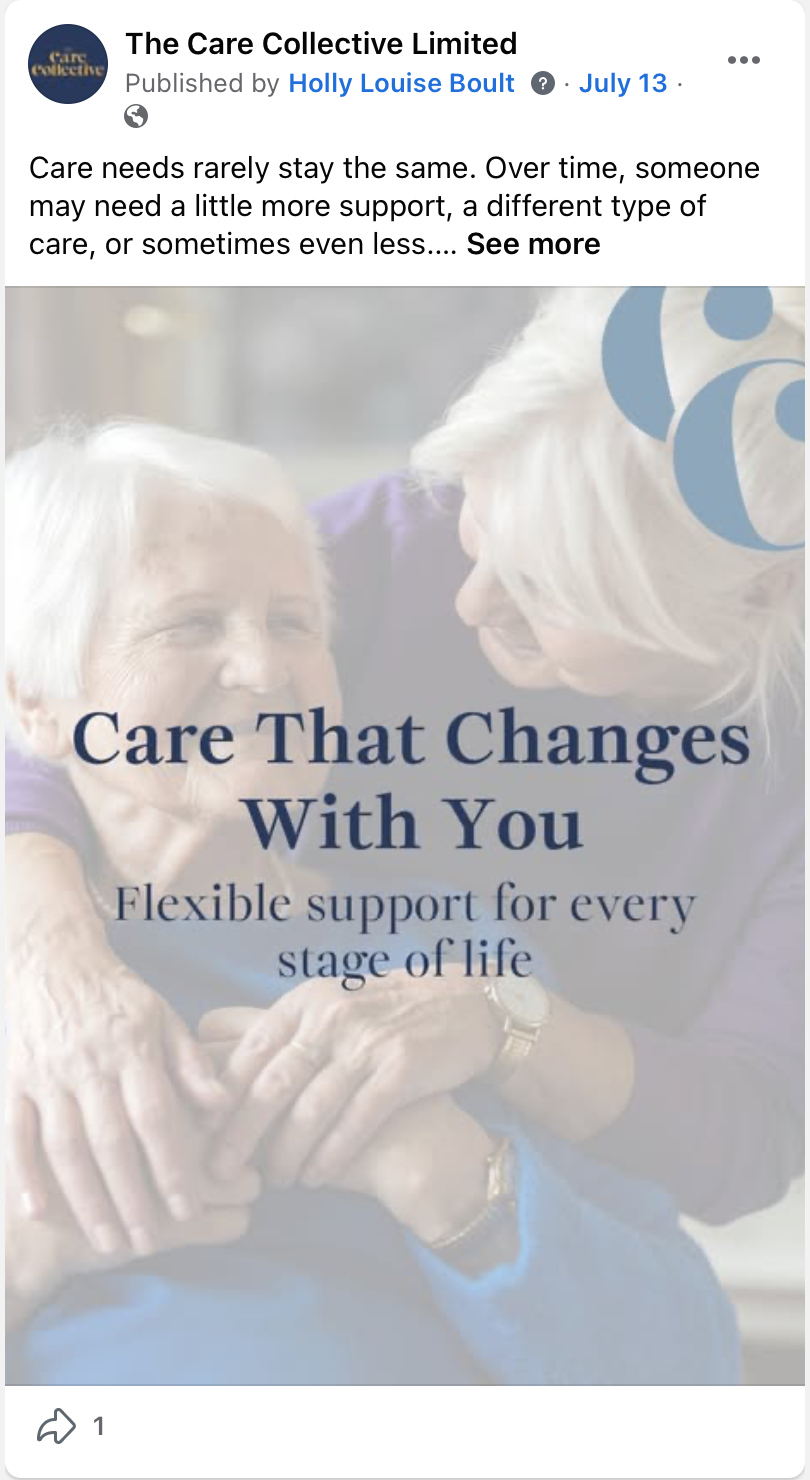
The top performing post by engagement rate was the "Autism Support at Home" post, with a 2.33% engagement rate. Second was the recruitment post, at 2.04%. Third was the "flexible care" post, at 1.75%. It's worth noting these rates are each based on just 1 interaction per post. Engagement is naturally low as we're just under 2 months into posting on Facebook and team interaction (as above) will help here too, as it signals to the algorithm that people are interested in the content, which helps it reach more users' feeds.
Floor Ten suggestions
The top 3 posts suggest that more specific, service-focused content may resonate better than generic brand messaging, though the volume of engagement is small to confirm this yet. In the next month, it is worth testing more content in these themes going into August to see if the same trends continue. We're hoping to gather more detailed information from Kelly once things are less busy on her end, which will help us move away from more generic content and sustain the strong growth seen in impressions and reactions this period. In the meantime, we'll focus on incorporating more reactive content into the mix.
NOTE we are not reporting combined data of Facebook and Instagram in these figures and as such only Facebook stats are being tracked.