Optifi · Linkedin · May 2026
Overview
The numbers
At a glance
We are still seeing an increase in follower growth this period, by +1.85%, which shows we are still building the audience in the right direction. To keep this steady growth page admins should continue to invite people to follow the page on a monthly basis so we can continue to see this growth. [Action: This note is to be shared with the team]
Community growth
Followers
Paid followers
Total content
Content reach
Impressions
Posts
Page views
Avg unique visitors
At a glance
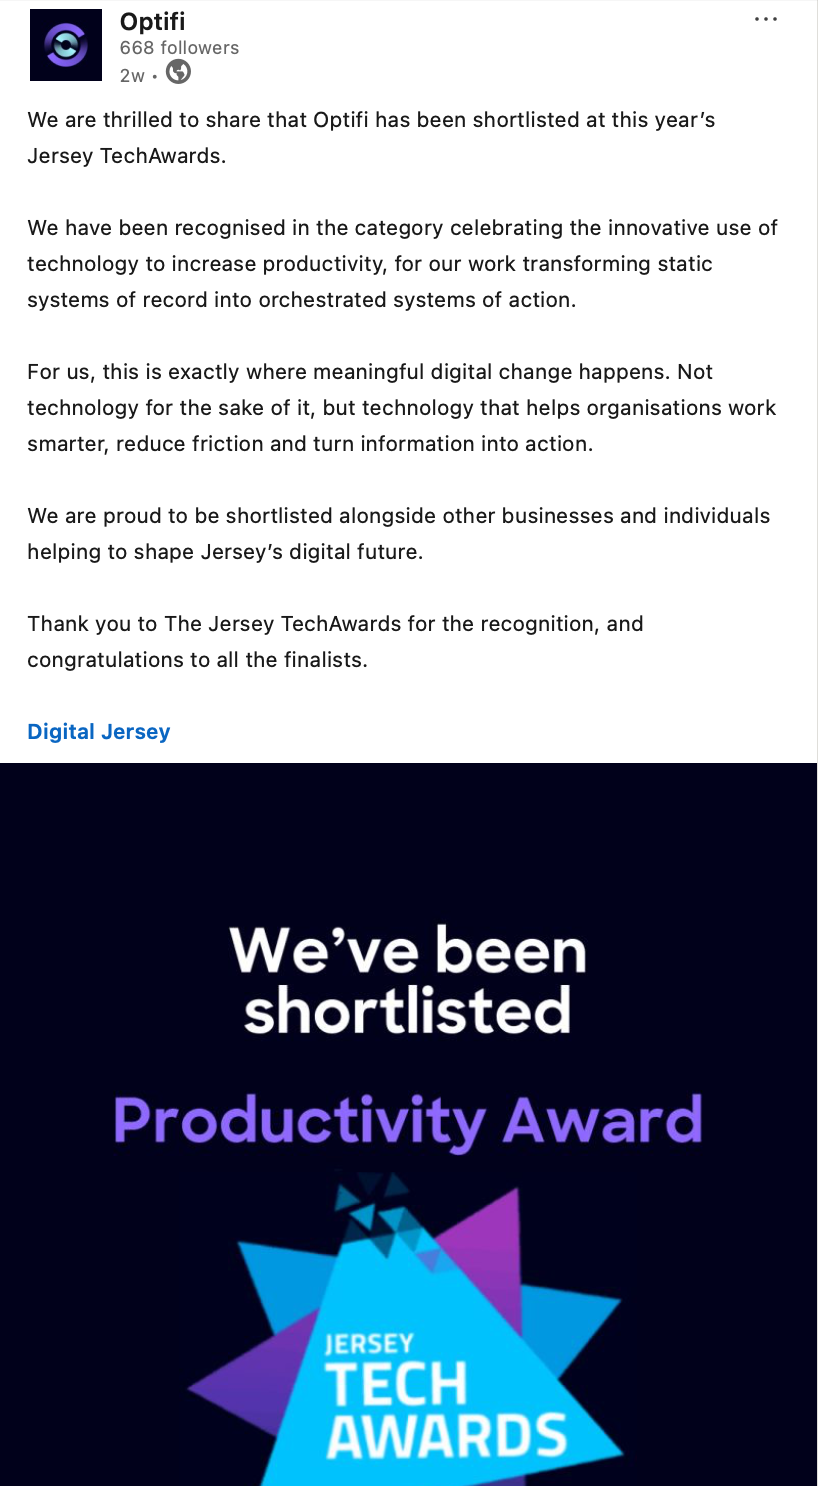
Impressions represent the total number of times your posts were seen. It also tells us if the algorithm likes the content and is showing it to people. Impressions have decreased this month by -19.93%, this is likely due to the increase last month because of a standout post about Alain on 22nd April which generated 1,758 impressions! The strongest post was this month was the Jersey TechAwards shortlist announcement, which achieved 853 impressions and 91 interactions, showing that company news and recognition content works well. Page views increased by 36.36%, which suggests prospects are going through the funnel which is great to see.
Interactions
Reactions
Comments
Clicks
Shares
At a glance
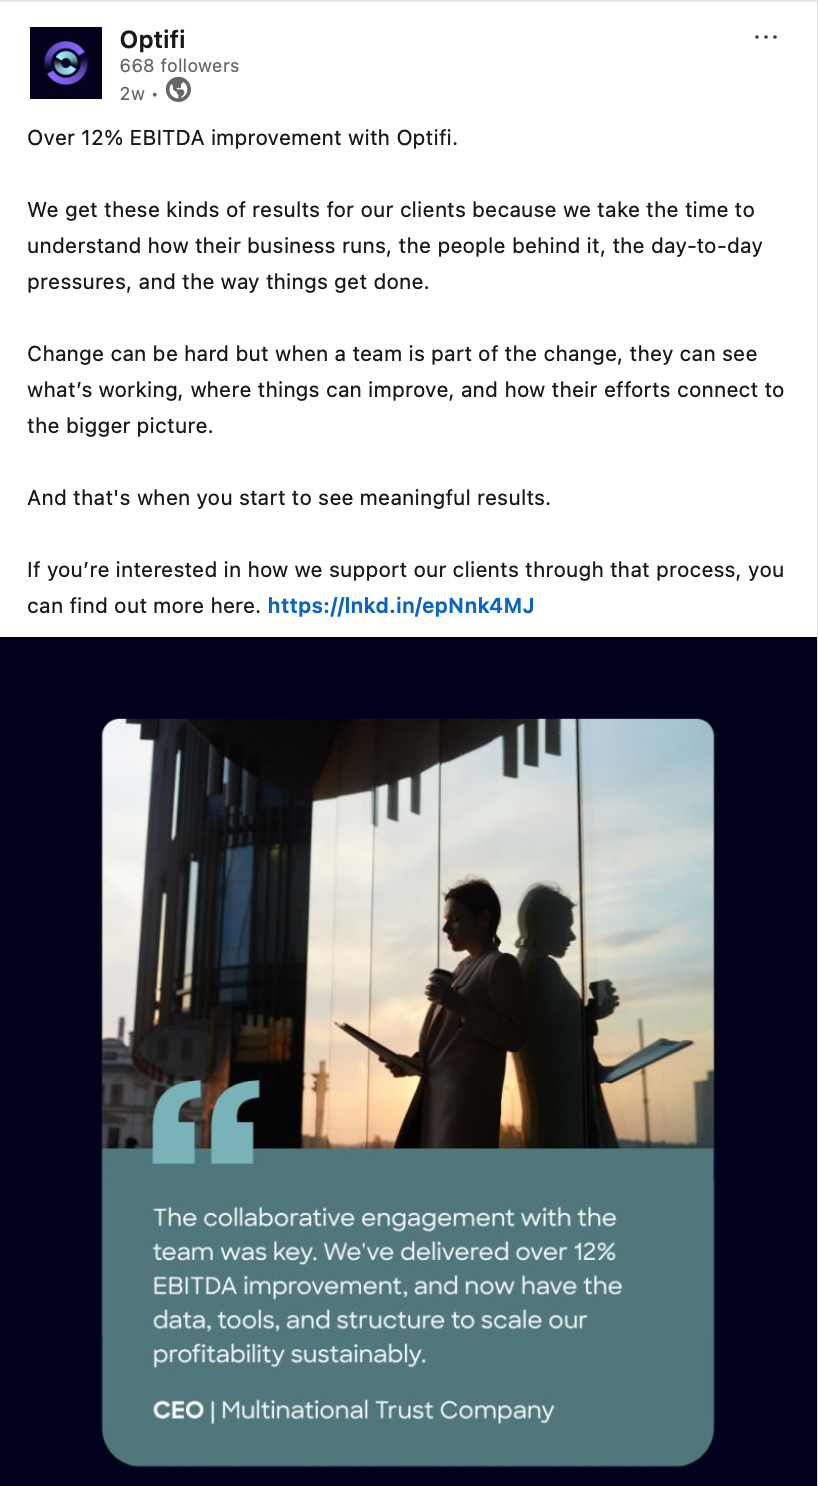
In this period, we have seen an increase of +21.43% in comments, a decrease of -22.22% in interactions and a decrease of -26.17% in clicks. This is also likely due to the spike in interactions in the previous period, we will continue to keep an eye on this and a reminder for Optifi team members to continue commenting on posts to keep engagement up. The ROI-focused post performed particularly well for engagement this month with 101 interactions, showing that measurable results and commercial value are strong content themes. [Action: This note is to be shared with the team]
Top posts
May 2026
At a glance
Our top 3 performing posts included content around services, business efficiency and the Tech awards shortlisting in this period, a good mix of news and sales. Overall engagement has been good in this period with the highest engagement being 11.80%. Note: Good Linkedin engagement average rate - 3.38%.
Floor Ten suggestions
In June we will continue with topical event-led content, ROI messaging and practical posts that show how Optifi helps trust and corporate services firms save time, improve efficiency and manage data more effectively. We are still waiting on the videos from Q1 and hope to have these too in June.