Optifi · Linkedin · Jun 2026
Overview
The numbers
At a glance
Follower growth continued positively, increasing by 3.02% to 682. To keep this steady page admins should continue to invite people to follow the page on a monthly basis. [Action: This note is to be shared with the team]
Community growth
Followers
Paid followers
Total content
Content reach
Impressions
Posts
Page views
Avg unique visitors
At a glance
Impressions represent the total number of times your posts were seen. It also tells us if the algorithm likes the content and is showing it to people. This month impressions were down -19.42%. Please can the Optifi team prioritise getting the long form content and video content to F10 with urgency, as we are focussed on brand based messaging at the moment and this is not sustainable for impresion growth.
Page views however are up +17.04% and average unique views are too at +6.67% which shows the content we are creating is driving people through to the Optifi page which is good to see.
Interactions
Reactions
Comments
Clicks
Shares
At a glance
Our interactions were up this month which also increases the engagement rate. Reactions were up +0.65%, comments were up +22.73% and clicks were a key highlight, increasing by 149.25% to 668, showing the content encouraged people to take action and explore further. The client experience post generated 482 clicks showing that content around real client value resonates strongly.
Top posts
Jun 2026
At a glance
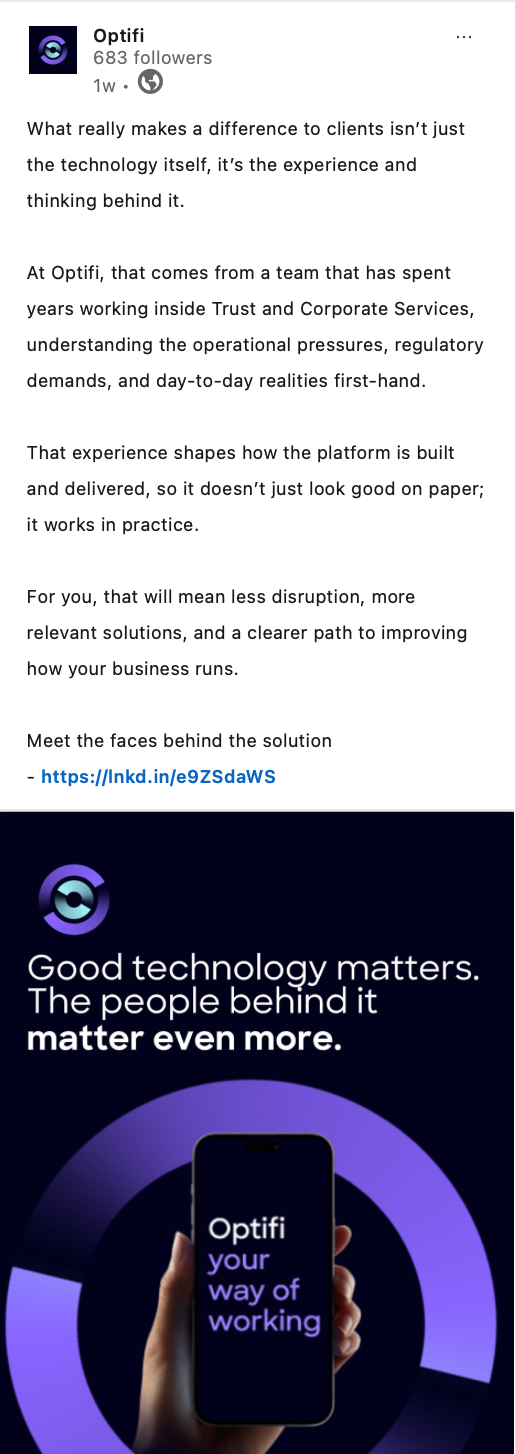
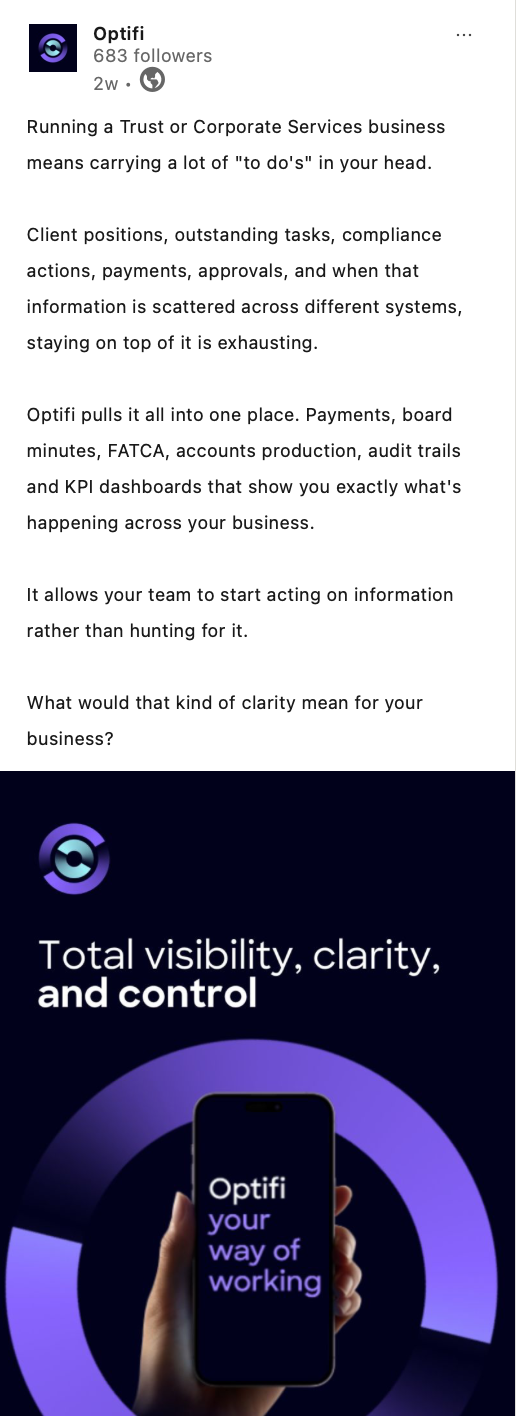
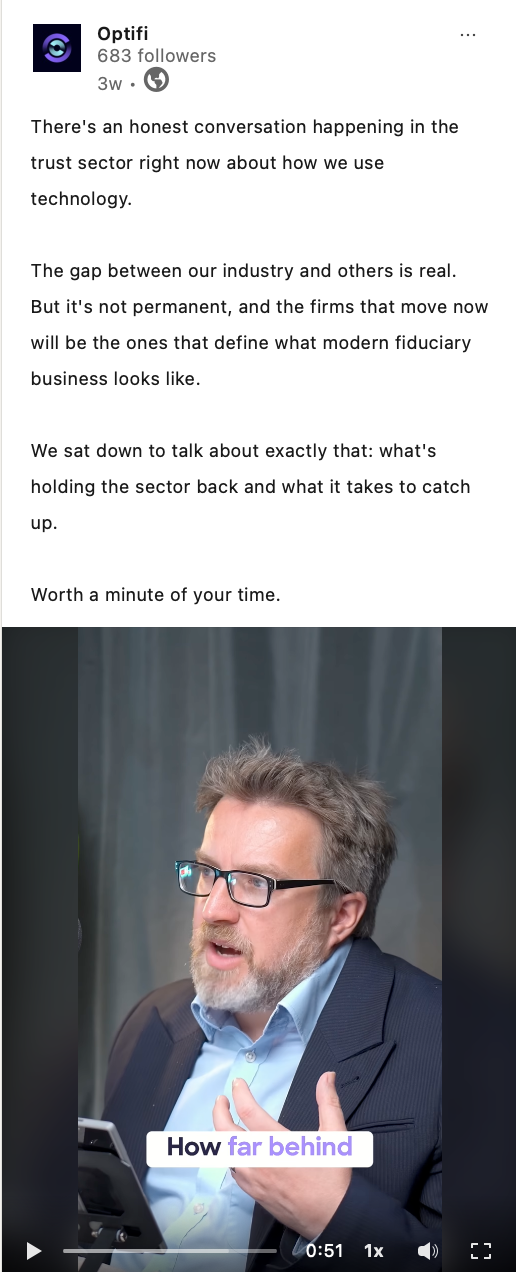
Our top 3 performing posts included content around client experience and a video clip on technology in the trust sector. Our top post on client experience/meet the team gained a 160.59% engagement rate, which is really impressive. This is likely due to the post gaining 482 clicks. Note: Good Linkedin engagement average rate - 3.38%.
Floor Ten suggestions
In July we will continue with product based content, AI, governance, trust sector insights and TechAwards content, as these themes are helping Optifi build credibility and drive stronger engagement.