Optifi · LinkedIn · July 2026
Overview
The numbers
At a glance
Optifi’s followers grew to 709 in July, an increase of +3.96%. A total of 8 posts were published, down -33.33% from the previous month. We have a lot of content coming in the next few months so we will ramp up the posting consistency as these come through.
Community growth
Followers
Paid followers
Total content
Content reach
Impressions
Posts
Page views
Avg unique visitors
At a glance
Impressions increased to 4,209, up +11.08%, meaning Optifi’s content achieved greater overall visibility despite a small reduction in posts. The strongest post by impressions was the Cara post about making complex things feel simple, which achieved 1,888 impressions and 103 interactions. The TechAwards ticket post also supported visibility, achieving 528 impressions.
Interactions
Reactions
Comments
Clicks
Shares
At a glance
Interactions totaled 409, down -51.83%, mainly because June included an unusually high engagement spike. Cara’s post led by impressions and generated 103 interactions, while the carousel post Optifi’s key features recorded the highest individual interaction total at 185. Reactions increased to 164 (+5.81%) and shares rose to 3 (+50.00%), providing positive signals to build on through people-led and practical content about the platform. Comments however are down, -64.71% Action for the Optifi team to please prioritise this going forward.
Top posts
July 2026
At a glance
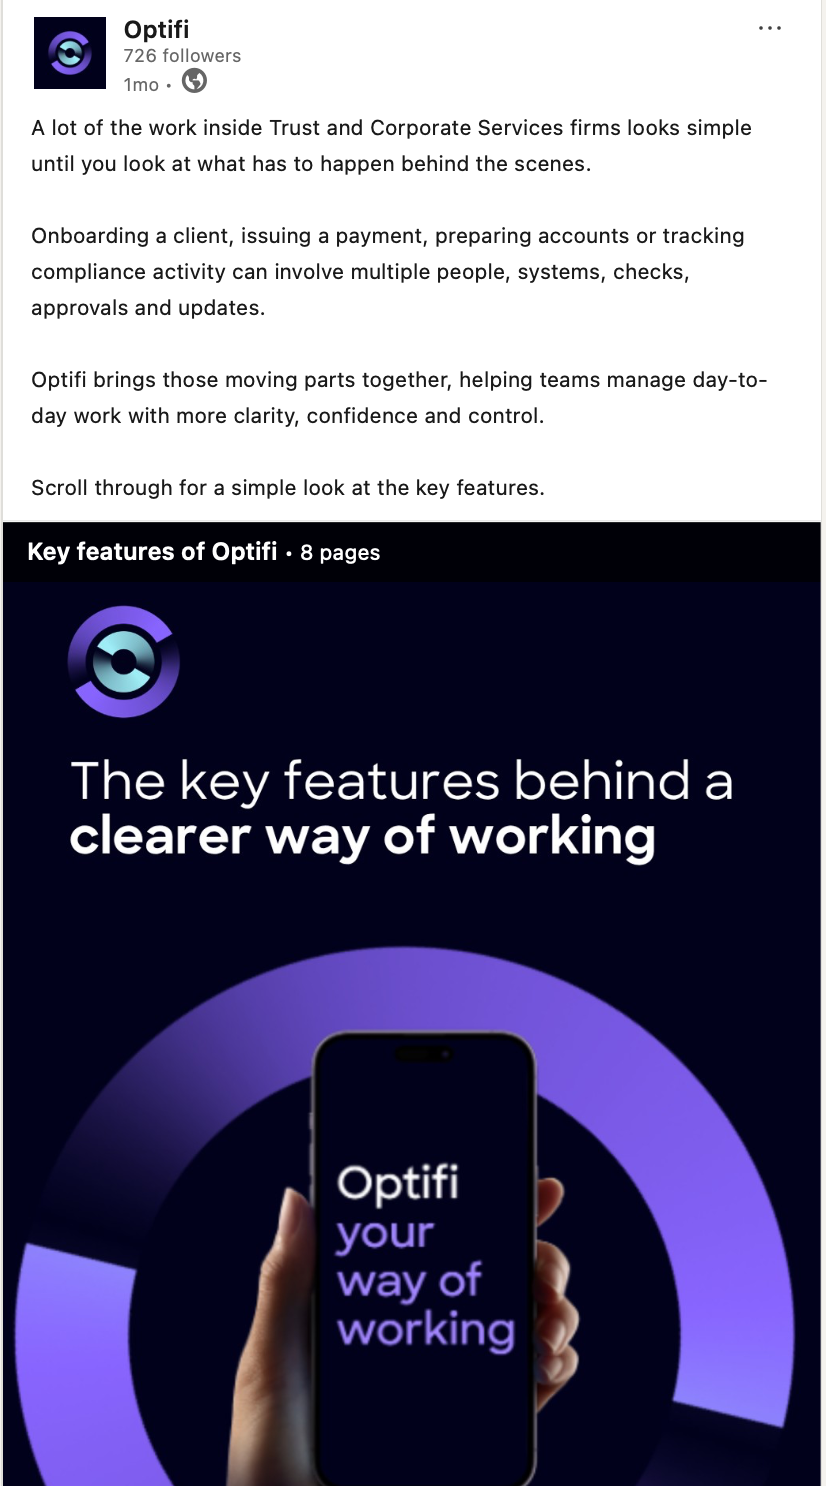
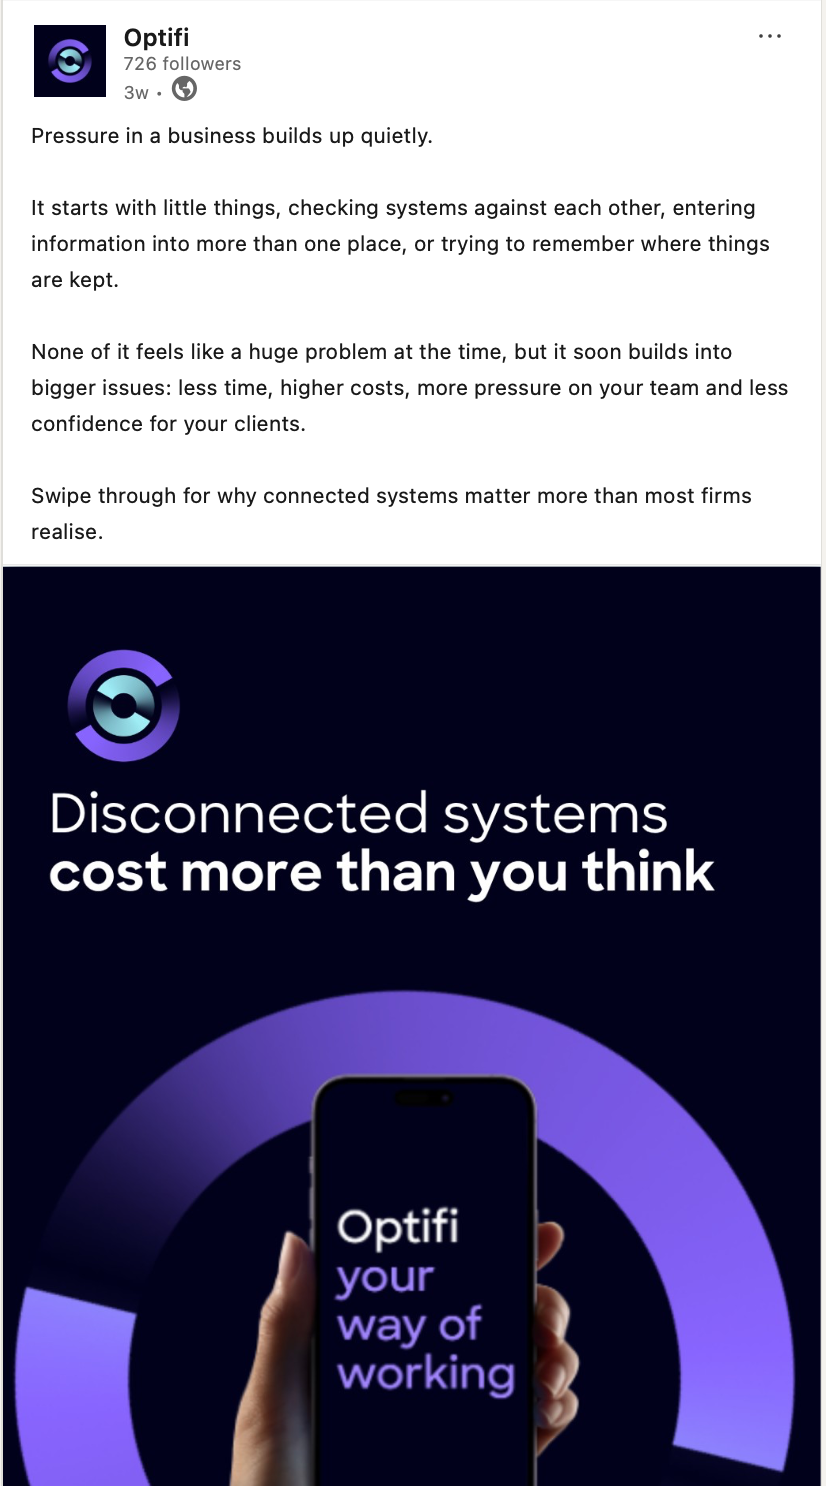
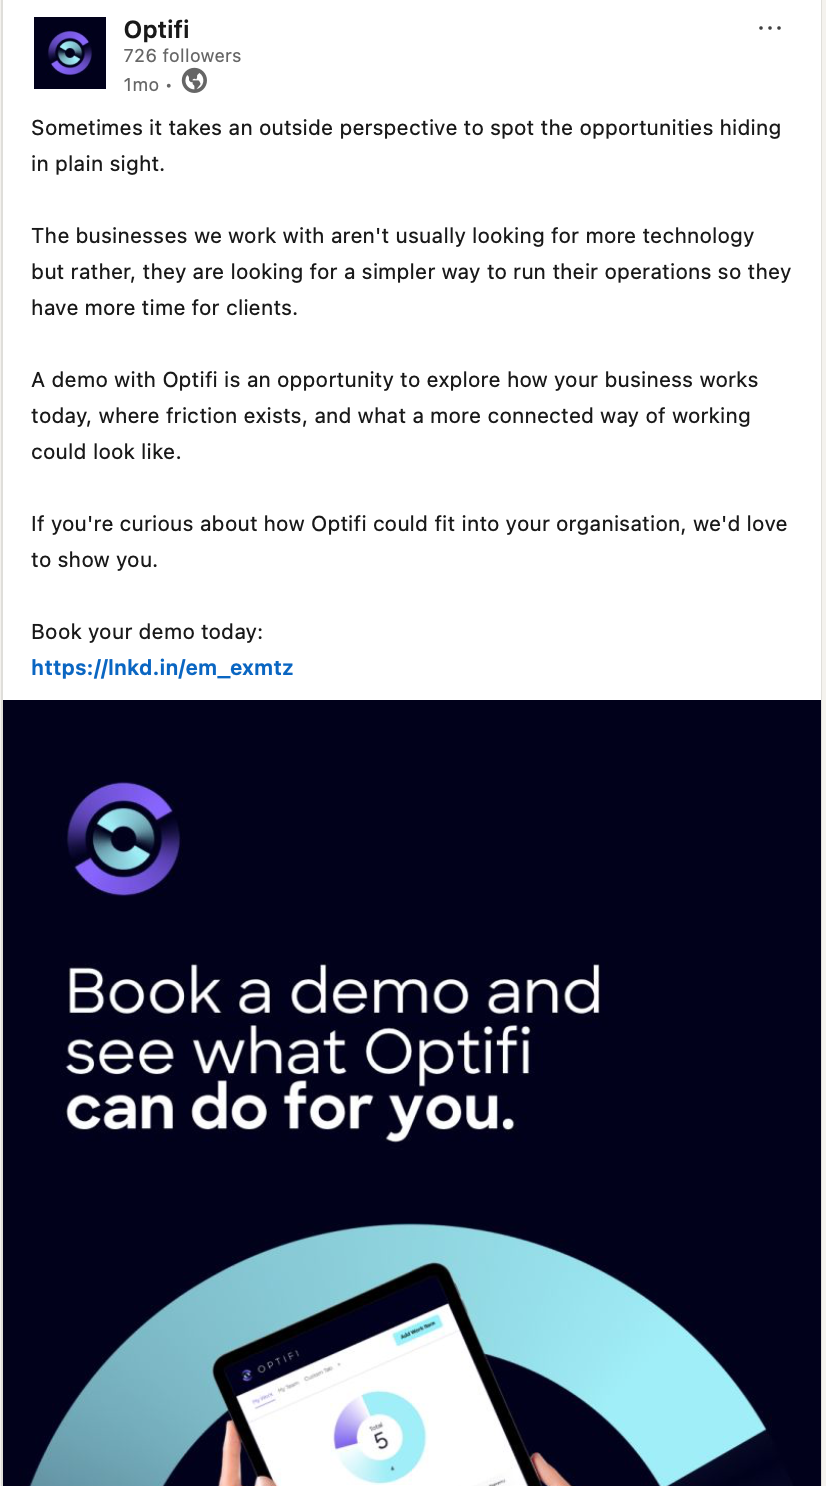
The top three posts by impressions focused on Cara, TechAwards and the Co-Valence partnership. The best post by engagement rate was the features carousel, which achieved 77.73%, substantially above the LinkedIn average of 3.38%. This indicates that practical content addressing complex processes can generate strong audience action, while people, event and partnership stories support broader visibility.
Floor Ten suggestions
Next month, we should continue with people-led posts, platform info and TechAwards content.